Conventional signs of topographic maps
Tikhonova L.Ya. geography teacher, MBOU "Lyceum No. 3", Prokhladny, KBR


Do you know the symbols?

Read the letter
Hello mother!
We went hiking. We left early in the morning
out, went on up,
turned west and approached
.To the right of us was,
. Then, past along
by we returned to.

The glorious hero Alyosha Popovich lived in Russia,
and he only knew how to lie on the stove, and with Tugarin
Let's fight the snake. He went once gold
free the people from the paws of the Tugarins.
His path lay through birch forest , past the rotten
swamps through which path was. I went
Alyosha into the very thicket of the forest and sees the picturesque Lake ,
and next to him forester's house . He asks the forester
how to get him river , where is the Tugarin army
located. And the old man answers him, the way is long
you have to. First you go to dirt road ,
turn into Pine forest . There you will see golodets ,
boldly go from him to spring , at the spring
have a deep ravine , you will cross it and you will see meadow ,
standing on that meadow lonely tree .
If you approach him, Tugarin himself will appear.
Write the story in symbols
http://aida.ucoz.ru

Determine the direction

Measure the distance using the scale in fig. 39
in 1 cm 100 m
- Determine the scale of the plan.
- Measure the distance from the birch to the barn with a ruler.
- Calculate the distance using the scale.
- Determine the distance from the birch to the point 162.3 m; to the lake; to the wooden bridge.
0.9 cm
0.9 cm x 100 m = 90 m

Draw a plan of the area
An observer stands in the center of the area in the meadow. He sees:
- North, 300 m, school
- East, 250 m, bushes
- N-W, 400 m, orchard
- To the south, 150 m, the lake, the eastern shore is swampy
- South-west, 200 m, bush
- On the s-v, 450 m, mixed forest
- 3, 200 m, light forest
- South-east, 100 m, well
M: in 1cm 100m
Plan from one point is called polar
http://aida.ucoz.ru

Draw a route plan for the area (M 1: 10000m)
The guys went from school (v. 1) on an excursion (the school is located in the northwest area)
v.1 → v.2 - on c. 800 m along the path through the orchard,
v.2 - a well on the bank of the river. Belka, the river flows from the south. US.
v.2→v.3 - 500 m against the river along the path through the bushes,
v.3 - spring,
t.3 → t.4 - on the s-w. on a dirt road through the field 400 m.
v.4 - a windmill, to the south of v.4 we saw a lake, the eastern shore of which is swampy,
t.4→t.5 - to the south-west. 400 m along the path through the meadow to the birch (v. 5),
vol.5 → vol.1 – back to school on a dirt road through woodlands
http://aida.ucoz.ru

draw a sign

draw a sign
windmill

draw a sign

draw a sign
rare forest

draw a sign
free standing tree
Laboratory work 1 Topic: Topographic maps and plans. Scales. Conditional signs. Linear measurements on topographic maps and plans Purpose: To get acquainted with topographic maps and plans, scales, types of symbols. Master the measurement and construction of segments using graphic scales Work plan: 1. Topographic plan and topographic map 2. Symbols 3. Scales, scale accuracy 4. Linear measurements on topographic plans and maps 5. Construction of segments of a given length using a transverse scale 6. Measuring the length of broken and curved segments 7. Homework (Individual settlement and graphic work)
1. Topographic plan and topographic map A topographic plan is a reduced and similar image on paper in conventional signs of horizontal projections of the contours of objects and the relief of a small area without taking into account the sphericity of the Earth. According to the content, plans are of two types: contour (situational) - they depict only local objects; topographic - local objects and relief are depicted.


1. Topographic plan and topographic map According to the content of the map, there are the following types: general geographical - they show the earth's surface in all its diversity; special purpose maps (soil maps, peat deposits maps, vegetation maps, etc.), on which individual elements are depicted with special completeness - soils, peat deposits, vegetation, etc. Maps are conditionally divided into three types according to the scale: small-scale (smaller than 1:); medium-scale (1: - 1:); large-scale (scale from 1: to 1:10,000); Scales of plans - larger than 1: Topographic map - a reduced generalized image in conventional symbols on paper of horizontal projections of the contours of artificial and natural objects and the relief of a significant area of the Earth, taking into account its sphericity.

2. Conventional signs Conventional signs, which are used to designate various terrain items on plans and maps, are the same for the whole of Russia and, according to the nature of the image, are divided into 2 groups. Scale (areal) symbols serve to depict objects that occupy a significant area and are expressed on the scale of a map or plan. An areal symbol consists of a boundary symbol of an object and icons that fill it or a symbol of color. At the same time, the objects of the area are depicted in compliance with the scale, which makes it possible to determine from a plan or map not only the location of the object, but also its size and shape. Off-scale are called such conventional signs, by which objects of the area are depicted without observing the scale of the map or plan, which indicates only the nature and position of the object in space in its center (wells, geodesic signs, springs, pillars, etc.). These signs do not allow us to judge the size of the depicted local objects. For example, on a large-scale map, the city of Tomsk is represented as an outline (to scale); on the map of Russia as a point (out of scale).

2. Conventional signs According to the way they are depicted on the map, conventional signs are divided into 3 subgroups: A. Graphic conventional signs - lines of various configurations (solid, dotted, dash-dotted ...), as well as their combinations in the form of geometric shapes. Graphic conventions are used to depict objects of a linear type: roads, rivers, pipelines, power lines, etc., the width of which is less than the accuracy of the scale of this map. B. Color conventions: shading with color along the contour of the object; lines and objects of different colors. C. Explanatory symbols - supplement other symbols with digital data, explanatory inscriptions; are placed next to various objects to characterize their property or quality, for example: the width of the bridge, the type of trees, the average height and thickness of trees in the forest, the width of the carriageway and the total width of the road, etc. On topographic maps, conventional signs are indicated in a strictly defined sequence: Explanations for conventional signs are always given on the right and only on training maps.


3. Scales, scale accuracy When drawing up maps and plans, horizontal projections of segments are depicted on paper in a reduced form, i. on a scale. Scale of the map (plan) - the ratio of the length of the line on the map (plan) to the length of the horizontal projection of the terrain line:. (1) Scales are numerical and graphic. Numerical 1) In the form of a simple fraction:, (2) where m is the degree of reduction or the denominator of the numerical scale. 2) In the form of a named ratio, for example: in 1 cm 20 m, in 1 cm 10 m Using scales, you can solve the following problems. 1. According to the length of the segment on the plan of a given scale, determine the length of the line on the ground. 2. According to the length of the horizontal projection of the line, determine the length of the corresponding segment on the scale plan.

3. Scales, scale accuracy In order to avoid calculations and speed up work, as well as improve the accuracy of measurements on maps and plans, graphic scales are used: linear (Fig. 1.2) and transverse (Fig. 1.2). Linear scale - a graphic representation of a numerical scale in the form of a straight line. To build a linear scale on a straight line lay a series of segments of the same length. The original segment is called the base of the scale (O.M.). The base of the scale is the conditionally accepted length of the segments plotted on a linear scale from zero on the right side of the linear scale and one division on the left side, which in turn is divided into ten equal parts. (M = 1:10000). The linear scale allows you to evaluate the segment with an accuracy of 0.1 fractions of a base accurately and up to 0.01 fractions of a base per eye (for a given scale) m 200 base

3. Scales, scale accuracy For more accurate measurements, a transverse scale is used, which has an additional vertical construction on a linear scale. Transverse scale After setting aside the required number of scale bases (usually 2 cm long, and then the scale is called normal), restore the perpendiculars to the original line and divide them into equal segments (into m parts). If the base is divided into n equal parts and the division points of the upper and lower bases are connected by inclined lines as shown in the figure, then the segment. The transverse scale allows you to estimate the segment exactly at 0.01 shares of the base, and up to 0.001 shares of the base - by eye. base A e g 3 p 1 2 f d 0 B m n n c

3. Scales, scale accuracy The transverse scale is engraved on metal rulers, which are called scales. Before using the scale bar, you should evaluate the base and its shares according to the following scheme. Example: Let the numerical scale be 1:5000; 0.1 scale base - 10 m; 0.01 scale base - 1 m; 0.001 scale base - 0.1 m.

3. Scales, scale accuracy Scale accuracy makes it possible to determine which terrain objects can be depicted on the plan and which cannot because of their small size. The reverse question is also being solved: on what scale should the plan be drawn up so that objects having, for example, dimensions of 5 m, are depicted on the plan. In order to make a certain decision in a particular case, the concept of scale accuracy is introduced. In this case, they proceed from the physiological capabilities of the human eye. It is accepted that it is impossible to measure the distance using a compass and a scale ruler, more accurately than 0.1 mm, on this scale (this is the diameter of a circle from a sharply honed needle). Therefore, the maximum accuracy of the scale is understood as the length of the segment on the ground, corresponding to 0.1 mm on the plan of this scale. In practice, it is accepted that the length of a segment on a plan or map can be estimated with an accuracy of ± 0.2 mm. The horizontal distance on the ground, corresponding to a given scale of 0.2 mm on the plan, is called the graphic accuracy of the scale. Therefore, at this scale (1:2000), the smallest differences that can be identified graphically are 0.4 m. The accuracy of the transverse scale is the same as the accuracy of the graphical scale.

4. Linear measurements on topographic maps and plans Segments, the length of which is determined from a map or plan, can be straight and curvilinear. It is possible to determine the linear dimensions of an object on a map or plan using: 1. a ruler and a numerical scale; By measuring the segment with a ruler, we get, for example, 98 mm, or on a scale of -980 m. When evaluating the accuracy of linear measurements, it should be taken into account that a segment with a length of at least 0.5 mm can be measured with a ruler - this is the magnitude of the error in linear measurements using a ruler 2. measuring compass and linear scale; 3. compass-measuring and transverse scale.

4. Linear measurements on topographic maps and plans of a measuring compass and a linear scale; The measurement of segments using a linear scale is carried out in the following order: take the segment to be measured into the solution of the measuring compass; attach the compass solution to the base of a linear scale, while combining its right leg with one of the strokes of the base so that the left leg fits on the base to the left of zero (on a fractional basis); count the number of integers and tenths of the scale base:

4. Linear measurements on topographic maps and plans of the measuring compass and transverse scale digitize the transverse scale (normal) on the map scale (in this case 1:10000): .0 7 o. m. 0.001 o.m. 0.8 o.m o.m.

5. Construction of segments of a given length using a transverse scale Let it be required to plot a segment on a map at a scale of 1:5000, the length of which is 173.3 m. 1. Make a painting in accordance with the scale of the map (1:5000): tenths, hundredths and thousandths of a scale base. 3. Dial on the measuring compass using a transverse scale the calculated number of whole, tenths, hundredths and thousandths of the scale bases. 4. Draw a segment on paper - pierce a sheet of paper and circle the resulting two points with circles. The diameter of the circles is 2-3 mm. Section length Fig. 6. Making a segment of a given length on paper

6. Measurement of the length of broken and curved segments Measurement of broken segments is carried out in parts or by the method of extension (Fig. 7): set the legs of the meter at points a and b, lay the ruler in the direction b-c, move the meter leg from point a to point a1, add a segment b-c, etc. a а1а1 а3а3 c e d b а2а2 7. Measurement of the length of broken segments by the method of extension Measurement of curved segments is possible in several ways:. 1.using curvimeter (approximate); 2. by extension; 3.constant solution meter.

7. Problem solving 1. The length of the line on the map (2.14 cm) and on the ground (4280.0 m) is known. Determine the numerical scale of the map. (2.48 cm; 620 m) 2. Write a named scale corresponding to the numerical scale 1:500, 1: (1:2000, 1:10000) 3. On the plan M 1:5000, display an object whose length on the ground is 30 m. Determine the length of the object on the plan in mm. 4. Determine the limiting and graphical accuracy of the scale 1:1000; 1: Using a measuring compass and a normal transverse scale, set aside a segment of 74.4 m on a sheet of paper on a scale of 1:2000. (1415 m on a scale of 1:25000) 6. Using a transverse scale, determine the distance between the absolute marks of the points - 129.2 and 122.1 (square of the training map). (141.4 and 146.4 (square 67-12). 7. Measure the length of the stream (to the Golubaya River) (square 64-11) using a curvimeter and a compass-measuring device with a solution of 1 mm. Compare the results. 8. Horizontal the distance between two points on the plan M 1:1000 is 2 cm. Determine the distance between these points on the ground.

 References 1.Methodological guidelines for the implementation of laboratory work on the discipline "Geodesy and topography" for full-time students of the direction "Geophysical methods of prospecting and Exploration of mineral deposits" and "Geophysical methods of well research". - Tomsk: ed. TPU, 2006 - 82 p. 2. Fundamentals of geodesy and topography: textbook / V.M. Perederin, N.V. Chukharev, N.A. Antropova. - Tomsk: Publishing House of the Tomsk Polytechnic University, p. 3. Symbols for topographic plans at scales 1:5000, 1:2000, 1:1000, 1:500 / Main Directorate of Geodesy and Cartography under the Council of Ministers of the USSR. – M.: Nedra, p.

- Lesson 1.
- Topographic maps
- educational goal:
- To form the foundations of moral and psychological stability in solving the problems of topographic support for combat operations.
- Learning goal:
- 1. To form knowledge of the purpose, classification, geometric essence and nomenclature of topographic maps; varieties and tactical properties of the terrain and their influence on the combat operations of the troops;
- 2. To instill the ability to read topographic maps and perform measurements on them, in orienting on the ground on a map and without a map.
- Literature
- 1. Textbook "Military Topography". Military edition 1972
- 2. Textbook "Military topography for cadets
- B.E. Byzov, I.M. Prishchepa.
- 3. Textbook "Fundamentals of military service." "Phoenix 2001",
- edited by V.A. Vasiliev.
- 4. "Officer card". Military Publishing, 1985, edited by Pombrick
- I.D., Shevchenko N.A.
- 5. IOS - information and educational site of SSTU
- named after Yu.A. Gagarin
- 6. Training program for reserve officers in the military
- departments according to VUS 180200
- 7. Qualification requirements for reserve officers
- VUS 180200;
- First question.
- The essence of the topographic image of the area and its main properties. Definition of concepts: topographic map and plan; level surface, ellipsoid, map scale. Mathematical and geodetic basis of topographic maps. Topographic maps of foreign countries.
- Second question.
- Third question.
- Types of conventional signs, color design of maps, explanatory inscriptions and digital designations. Classification and representation on maps of the hydrographic network, settlements, social and cultural facilities, road network, soil and vegetation cover and other topographical elements on the ground.
- Study and evaluation of terrain elements on the map, determination of their quantitative and qualitative characteristics, their influence on the organization and conduct of combat operations of troops.
- First question.
- The essence of the topographic image of the area and its main properties. Definition of concepts: topographic map and plan; level surface, ellipsoid, map scale. Mathematical and geodetic basis of TC. TK of foreign countries.
- The geometry of the cartographic image is associated with the idea of the figure of the Earth - its geometric shape and dimensions.
- The geographical position of points on the earth's surface is determined, as is well known, by their coordinates. Therefore, the mathematical problem of constructing a cartographic image is to project and depict the spherical surface of the Earth on a plane (map), while strictly observing the one-to-one correspondence between the coordinates of points on the earth's surface and the coordinates of their image on the map.
- Such a design is associated with the need to assign
- results of field geodetic measurements during their calculation
- processing and display on the map to a certain, good
- studied geometrically, a surface that
- most closely fits in its form to the real figure of the Earth.
- The figure of the Earth is understood as a mathematical figure,
- bounded by the surface of the average level of the world ocean in
- his calm state, mentally continued under the surface
- all continents. This imaginary surface is perpendicular to
- cular at all points to the direction of the plumb line
- (the direction of gravity) is called the basic level
- surface, and the figure of the Earth formed by it is the geoid.
- Geoid (ellipsoid), as studies have shown, names everywhere
- convex, but osymmetrical, complex and irregular in
- geometrically a figure, which, however, is not enough
- differs from the ellipsoid of revolution, i.e. correct geometric
- which body formed by the rotation of an ellipse around its minor axis.
- Therefore, in geodetic measurements and mapping
- the figure of the Earth is taken as such an ellipsoid.
- On maps, this surface is represented by a grid of geographic
- coordinates (meridians and parallels). Such a grid on the maps
- called a map grid.
- When drawing up a map, a cartographic map is first applied
- grid, and then according to the materials of topographic and geodetic survey of the area
- apply relief and local objects.
- Thus, mapping the image of the earth
- surface is a dual design process
- including at the same time the transition from the actual outlines
- depicted objects to their horizontal positions on
- the surface of the earth's ellipsoid, i.e. physical
- Earth's surface on an ellipsoid along the normals (perpendiculars) to
- its surface, and the image on the plane, i.e. on the map of these
- horizontal positions on a given scale and
- mathematical rules defined for this card.
- Mathematically defined way of constructing on a plane
- cartographic grid of one kind or another, on the basis of which
- map depicts the surface of the earth, called cartographic
- projection.
- MAP (geographical) is an image of the earth
- surface, built on a plane according to certain
- mathematical rules.
- The great importance and variety of applications are due to
- features of the cartographic image.
- The most important of these features are:
- - scale - strict proportionality of the cartographic
- images of objects on it - their coordinates, territorial
- dimensions and placement;
- - clarity and expressiveness of the cartographic image,
- allowing quick and unambiguous perception of semantic
- the value of each element. This is achieved by using
- maps of a clear scientifically developed system
- cartographic, color and alphanumeric designation
- depicted objects;
- - purposefulness of content and semantic capacity
- images based on rational selection, generalization
- and system display of the most essential features and objects
- cartographic territory. This allows you to quickly
- exhaustive for this map completeness and detail
- determine by it not only the external signs of the depicted
- objects, but also their more versatile characteristics.
- Topographic maps as measuring documents and
- the main sources of information about the area serve as one
- of the most important means of command and control. Via
- maps study the terrain, navigate in combat conditions,
- perform the necessary measurements and calculations,
- the organization of interaction between troops is carried out, according to them
- the coordinates of the targets and the topogeodesic
- binding elements of battle order.
- SCALE of the map - the ratio of the length of the line on the map or
- another geographical document to the length of the corresponding line
- on the ground.
- According to its scope and main purpose
- topographic maps can be divided into:
- 1:25000; 1:50000 - large scale;
- 1:100000; 1:200000 - medium scale;
- 1:500000; 1:1000000 - small scale.
- In order to properly and fully use the maps as
- measuring documents, it is necessary to understand them well
- geometric essence and mathematical principles of construction.
- Plan (topographic) - an image on orthogonal paper
- projections of a small area. Plans are being made
- usually on a large scale; local items on them
- are characterized, as a rule, in more detail than on the maps.
- Topographic maps of foreign countries. Topographic
- maps of different states are far from the same in projections and
- scale, as well as in terms of content and design.
- However, the principle of constructing a cartographic drawing
- terrain and graphic representation of the terrain and its elements
- are similar and therefore the language of topographic maps in a known
- degrees can be considered international. However, one must take into account
- that the scales of foreign maps may be drawn up in inches,
- miles, etc.
- Terrain on most topographic maps
- foreign countries are depicted in the same way as ours. Almost all
- states use the same colors for the design of maps as
- we have. Significant difficulty can only cause inscriptions on
- foreign languages.
- Second question.
- Layout and nomenclature of TC. Determination of the nomenclature of adjacent sheets, drawing up an application for maps according to the combined table for the area of \u200b\u200bthe unit.
- Each sheet of a topographic map has a frame in the form of a trapezoid, the upper and lower sides of which are parallels, and the sides are meridians.
- Such a division of the map into separate sheets is called the layout of the map.
- Thanks to the geographical grid underlying the division
- maps on sheets determined by location on the globe
- any part of the terrain depicted on this map sheet.
- In addition, the coincidence of the sides of the frame with the meridians and parallels determines their location in relation to the sides of the horizon; the upper side of the map sheet is north, the lower side is south, the other sides of the horizon, respectively.
- To easily and quickly find the desired map sheets of a particular
- different scale and region, each sheet according to a certain
- the rule is assigned its own numerical and alphabetic designation -
- nomenclature.
- The basis for compiling the nomenclature of sheets of maps is the sheet
- maps at a scale of 1:1,000,000. Such a map sheet has 6 ° in longitude
- and 4° in latitude.
- The nomenclature of the map sheet M 1:1 000 000 is composed of the indication
- Rada and columns. Row counts are indicated by capital letters
- Latin alphabet starting from the first and is conducted from the equator to
- poles.
- Columns of sheets are indicated by Arabic numerals from I to
- XXXXXXX and the count is from the Greenwich meridian from the West to
- East.
- One sheet of a map at a scale of 1:1,000,000 corresponds to 4 sheets
- maps of scale 1: 500,000 and are designated 0-4I-A or B, C, D.
- Counting is done from A from left to right and from top to bottom to D.
- To obtain map sheets M 1:200,000 map sheet 1:1,000,000
- divided into 36 sheets and indicated by Roman numerals from X to
- XXXXI, i.e. map sheet at a scale of 1:200,000 will have
- nomenclature 0-4I-XXI, etc.
- To obtain a 1:100,000 card, sheet M 1: 1,000,000 is divided into
- 144 sheets and are designated from right to left and from top to bottom in Arabic
- numbers from I to 144. The nomenclature of the map M 1: 100,000 will be 0-41-1
- etc.
- Thus, the layout of the scale map sheet is carried out
- 1:100 000.
- Further, the layout of the maps is carried out as follows: sheet
- M1:1,000,000 maps are divided into 4 map sheets at a scale of 1:50,000
- and is indicated by capital letters from A to G from left to right and
- top down. Thus, the scale map sheet nomenclature
- 1:50,000 would be 0-41-109-A or B, C, D.
- In the same order, they receive a card M 1: 25,000 based on
- division of the map sheet M 1:50 000, while the designation
- carried out in small letters a, b, c, d, and will be 0-41-110-B-d.
- The nomenclature of each sheet of the map is indicated above the northern
- side of its frame (in the middle or on the right).
- Next to the nomenclature of the sheet, in addition, is signed
- the name of the largest settlement. On every sheet
- also indicates the nomenclature of adjacent, directly
- sheets adjacent to it. These signatures are placed in the middle
- outer frame on all four sides.
- For faster selection and definition of the nomenclature
- map sheets for the upcoming combat area exist
- assembly tables.
- Prefabricated tables are schematic maps
- small scale, divided by meridians and parallels into
- small cells. Each cell corresponds to a sheet of the map of the given
- scale, and its numbering indicates the nomenclature of the sheet.
- Extract of the nomenclature of the required sheets according to the prefabricated table
- done from left to right and top to bottom.
- Responsibility for the supply of maps and prefabricated tables
- units and subunits is carried by the higher headquarters. prefabricated
- tables and maps are stored in the secret part of the regiment.
- Platoon and company commanders receive cards at the battalion (division) headquarters.
- Topographic maps provide detailed information about
- terrain, allowing you to accurately determine the coordinates of points
- terrain and objects located on it. Therefore, in any
- situation, each commander and all military personnel are obliged
- handle received cards with care, store them as
- important documents, strictly observe the established order of their
- accounting, storage and use.
- Vigilant and careful handling of topographic maps
- every boss must educate his subordinates.
- Third question.
- Types of conventional signs, color design of maps, explanatory inscriptions and digital designations. Classification and representation on maps of the hydrographic network, settlements, social and cultural facilities, road network, soil and vegetation cover and other topographical elements on the ground. Study and evaluation of terrain elements on the map, determination of their quantitative and qualitative characteristics, their influence on the organization and conduct of combat operations of troops.
- All objects on the maps are represented by topographic symbols.
- Topographic symbols are a unified system for designating various topographic objects, in combination with contour lines, they allow you to display a real picture of the terrain on the map.
- Conventional signs according to their purpose and properties are divided into three types:
- - scale (contour);
- - off-scale (point);
- - explanatory.
- Scale or contour symbols
- the objects expressed in the scale of the map are denoted, i.e.
- such dimensions, which (length, width, area) can be
- measure on the map.
- Each such sign consists of a contour, i.e. planned outline
- the depicted object and the filling explanatory
- designations in the form of background coloring, color shading or
- grids of icons identical in design, indicating the genus,
- kind of object.
- The contours of objects are shown on the maps by dotted lines, if they
- do not coincide with other terrain lines, which are indicated
- conventional signs.
- Off-scale or point symbols
- small objects are depicted (wells, structures
- tower type, free-standing trees, etc.), not
- expressed on the scale of the map and therefore they can be represented
- on it only as a dot.
- The figured drawing of such a sign includes, as it were, the main point,
- showing the exact location of this object on
- area and means what kind of object it is. Such a main point
- applied:
- - signs of symmetrical shape (circle, square, rectangle,
- asterisk) - in the center of the figure;
- - for signs having the shape of a figure with a wide base -
- in the center of the base;
- - for signs having a base in the form of an angle - at the top of the angle;
- - for signs that are a combination of several figures in
- the center of the bottom figure.
- These main points should be used when conducting
- precise measurements on the map.
- Off-scale signs also include linear objects,
- such as roads, streams, etc., which only have length to scale,
- and the width cannot be drawn to scale. The position of such
- objects on the ground corresponds to the longitudinal axis of the sign on
- map.
- Off-scale symbols by themselves do not indicate
- sizes of objects or the area occupied, therefore it is impossible
- measure on the map, for example, the width of the bridge.
- Explanatory symbols are used for
- additional characteristics of the object and displaying them
- varieties. For example: a conventional sign of coniferous or
- deciduous forest inside the outline of the sign shows
- dominant tree species, the arrow on the river indicates
- direction of flow, etc.
- In addition to conventional symbols on the maps, full and
- abbreviated inscriptions, as well as digital characteristics
- some objects.
- Fully signed own names
- settlements, rivers, mountains, and individual tracts. Fonts
- signatures of the names of settlements and rivers at the same time
- also serve as a symbol, since their size and
- they complement the characterization of these objects by their inscription.
- Abbreviated signatures accompanying some conditional
- signs explain the properties of the depicted objects, reporting them
- data that cannot be displayed graphically. So u
- symbols of industrial enterprises and some
- objects they indicate the kind of object or production.
- For example, - mash. - machine-building plant, vdkch - water pumping station,
- dog. – sand pit, etc.
- Abbreviated captions also explain the nature and
- some other objects that are not distinguished by a conventional sign,
- but stand out in their meaning. For example: school. - school,
- Mrs. - hospital, etc.
- The numbers indicate some numerical characteristics
- objects, for example: the number of households in rural areas
- points, elevations, the most characteristic elements
- relief, passes, water level in rivers, etc.
- Color design of cards.
- Maps are printed in colors for better readability. Thanks to
- to this, the image of the area is divided, as it were, into separate
- elements, each of which is clearly distinguished by its own color.
- The colors of the paints on the cards are standard and to some extent
- correspond to the actual color of the depicted objects:
- - forests, gardens, shrubs and thickets are highlighted in green on the maps
- color;
- - water bodies, as well as swamps, salt marshes - in blue;
- - relief elements and some types of soil (sands,
- pebbles, stony rocks) - brown;
- - highways and highways - orange;
- - unpaved improved roads - in yellow;
- - other elements of the content of the cards are printed - in black
- color.
- All local objects when depicted on topographic
- maps are divided into the following groups, for each of
- which has its own system of symbols:
- - vegetation cover and soil;
- - hydrography;
- - settlements;
- - industrial, agricultural and socio-cultural
- objects;
- - road network;
- - administrative boundaries;
- - individual local items - landmarks.
- VEGETATION COVER AND GROUND
- Coniferous forests (spruce, fir, pine, cedar, larch, etc.)
- Deciduous forests (oak, beech, maple, birch, aspen, etc.)
- mixed forests
- Characteristics of the forest stand in meters: in the numerator - 20 (25) - the height of the trees,
- in the denominator - 0.30 - thickness, to the right of the fraction - 5 (6) - the distance between the trees
- Narrow strips of forest and protective forest plantations
- (2- average tree height in meters)
- Small areas of forest that are not expressed on the scale of the map
- Separate groves that are not expressed on the scale of the map: 1) coniferous; 2) deciduous; 3) mixed
- Separate trees that have the value of landmarks: 1) coniferous; 2) deciduous
- Individual trees with no landmark value
- 1) Palm groves, expressed on a map scale; 2) palm groves that are not expressed on the scale of the map: 3) individual palm trees
- Low growing (dwarf) forests
- Forest growth, forest nurseries and young forest plantations up to 4 m high (2 - average tree height in meters)
- Windbreaks
- 1) Rare forests (woodlands),
- 2) Rare stunted forests
- 1) Burnt and dry forests
- 2) Cut down forests
- Clearings in the forest with a width of 20 m or more - on the map 1: 25000, 40 m or more - on the map 1: 50000, 60 m and more - on the map 1:100000 ; power lines along the clearings
- Other clearings in the forest (4-width of the clearing in meters); 22, 23-numbers of forest quarters
- Forest roads along clearings
- Communication lines along the clearings (5-width of the clearing in meters)
- Borders on clearings
- Shrubs: 1) individual bushes and groups of bushes;
- 2) continuous thickets
- Narrow strips of shrubs and hedges
- Shrub species: 1) coniferous; 2) deciduous (0.8 is the average height of a shrub in meters)
- Thorny bushes (continuous thickets)
- Saxaul: 1) separate groups; 2) continuous thickets
- Stlanik: 1) separate groups; 2) continuous thickets
- thickets of bamboo
- Meadow vegetation (less than 1 m high),
- 2) tall grass vegetation
- Reeds and reed beds
- Wet meadows (hollows), : 1) with herbaceous vegetation (shown only on a map at a scale of 1:25,000); 2) with reeds and reeds (not shown on a 1:100,000 scale map)
- Steppe (herbaceous) vegetation;
- 2) Semi-shrubs (wormwood, teresken, etc.)
- Moss and lichen vegetation
- Swamps impassable and difficult to pass
- (1.8 is the depth of the swamp in meters)
- Swamps passable (0.6-depth of the swamp in meters)
- The vegetation cover of swamps:
- 1) Herbaceous;
- 2) Moss;
- 3) Reed and reed
- Channels from 3 to 10m wide; water distribution devices: 1) water drainage in both directions; 2) water outlet in one direction
- Channels and ditches up to 3 m wide; trees and bushes along rivers, canals and ditches.
- Dry ditches: 1) less than 3 m wide; 2) 3 m wide; and more (5-ditch width in meters)
- Rivers, canals and ditches with dams on one or both sides
- Dams and artificial ramparts (2-height in meters)
- Lakes: 1) fresh; 2) salty; 3) bitter-salty
- Waterfalls and rapids (5-height of water fall in meters)
- Borders and areas of spills of large rivers and lakes with a duration of flooding of the area for more than two months; boundaries and areas of reservoirs under construction.
- Water level marks
- Arrows showing the direction of river flow
- (0.2-current velocity in m/s)
- Characteristics of rivers and canals: 170-width, 1.7-depth in meters, P-character of the bottom soil (P-sandy, T-hard, V-viscous, K-stony)
- Brody: 1.2-depth, 180-length in meters, T-character of the soil, 0.5-current velocity in m/s
- Transportation
- Ferries: 195-width of the river; 4x3 - dimensions of the ferry in meters; 8-carrying capacity in tons.
- 1:25 000
- 1:50 000; 1:100 000
- Wooden bridges
- Bridges metal
- Wooden bridges
- Bridges metal
- Bridges made of stone and reinforced concrete
- Lifting and adjustable
- floating bridges
- Two-tier stone and reinforced concrete bridges
- Chain and rope bridges
- Characteristics of bridges: K - building material (K - stone, M - metal, reinforced concrete, D - wooden); 8 - height above water level (on navigable rivers); 370 is the length of the bridge, 10 is the width of the carriageway in meters, 60 is the carrying capacity in tons.
- Bridges with a length of 3 m or more
- Bridges over minor obstacles (less than 3 m long)
- Gateways expressed at map scale
- (1-chamber, 2-gates of the lock), and their characteristics along the main course: 3 "-the number of cameras, 170-chamber length in meters, 15-gate width, 3.5-depth at the threshold of the gate
- gateways, not
- Embankments: 1) stone; 2) wooden
- Water metering posts and footstocks
- Dams: 1) passable; 2) impassable; K-material of the structure (K-stone, Concrete-concrete, reinforced concrete, D-wooden, Earth-earth) "250-length, 8-width of the dam along the top in meters; in the numerator - the mark of the upper level of the zoda, in denominator-lower.
- Underwater dams
- Surface water pipelines
- Underground water pipelines
- Active karezes (a number of wells connected by an underground channel)
- Karez inactive
- Main wells in the steppe and desert areas: 51.1 ground level, 25-well depth in meters, 20-filling in liters / hours
- Anchorages and piers without equipped berths
- Piers with equipped berths,
- not mapped to scale
- Moles and moorings: 1) expressed on the scale of the map,
- 2) not expressed in map scale
- Breakwaters and groins
- lighthouses
- Luminous buoys
- Floating lighthouses and floating lights
- Permanent riverside signaling signs
- Dry docks not expressed in sled scale
- Ellings, slipways
- Tidal currents (arrows with plumage - tides, without plumage - ebb)
- Small size jars (5-depth in meters)
- Underwater stones
- Surface stones
- Drying stones
- Surface rocks (12-height of the rock above the water in meters)
- Reefs: 1) underwater; 2) drying out
- Sea channels
- Isobaths and their signatures, depth marks
- Seaweed
- Fin accumulation sites
- CITIES
- 1: 25 000
- 50,000 inhabitants
- and more
- less
- 50,000 inhabitants
- 1: 50 000
- 50,000 inhabitants
- and more
- less
- 50,000 inhabitants
- 1: 100 000
- 1: 25 000
- 1: 50 000 1: 100 000
- Settlements with unsystematic buildings
- Settlements of a dispersed type
- Quarters with a predominance
- fire-resistant buildings
- Quarters with a predominance
- non-fire resistant buildings
- Note. On a 1:100000 scale map, fire resistance is not shown; The orange background shading in cities with 50,000 inhabitants or more represents densely built-up neighborhoods.
- Ruined and dilapidated neighborhoods
- Roadblocks (shown only on a 1:25000 scale map)
- Outstanding fire-resistant buildings (only shown on maps at scales 1:25000 and 1:50000).
- Residential and non-residential buildings
- Destroyed and dilapidated buildings
- Separate yards
- Parking lots of yurts, tents, etc.
- CITIES
- MOSCOW
- The capital of Russia, the capitals of foreign states with a population of over 1,000,000 inhabitants. Cities with a population of over 1,000,000 inhabitants.
- Capitals of foreign states with a population of less than 1,000,000
- residents. Cities with a population of 500,000 to 1,000,000 inhabitants.
- TOMSK
- Centers of edges, areas that are not part of the edge.
- Administrative centers of the 1st order on a foreign
- territory. Cities with a population of 100,000 to 500,000 inhabitants.
- MAIKOP
- Centers of autonomous regions that are part of the region. Centers of national districts. Cities with a population of 50,000 to 100,000 inhabitants.
- TORZHOK
- Cities with a population of 10,000 to 50,000 inhabitants
- ALEXIN
- Cities with a population of 2,000 to 10,000 inhabitants.
- VARNYAI
- Cities with less than 2,000 inhabitants.
- KOJORI
- 2000 inhabitants and more
- DUBKI
- less than 2000 inhabitants
- May
- over 1000 inhabitants
- Artemovsky
- Settlements at industrial enterprises, railway stations, marinas, etc.
- from 100 to 1000 inhabitants
- Rudnichny
- less than 100 inhabitants
- Settlements of rural and dacha type
- LABINSKAYA
- over 200 houses
- Goncharovka
- 100 to 200 houses
- Yurievka
- from 20 to 100 houses
- Lotoshino
- less than 20 houses
- Dinskaya
- separate yards
- Railways
- Three-track railways, semaphores and traffic lights, turntables
- Double track railways, stations
- Single-track railways, sidings, platforms and stopping points on broad-gauge railways
- Location of the main building of the station: 1) on the side of the tracks; 2) between paths; 3) location unknown
- Electrified railways: 1) three-track: 2) double-track; 3) single track; 4) roadblocks
- Waypoints, loading and unloading areas, dead ends and sidings
- 1) Mounds; 2) excavations (4-height or depth in meters);
- 3) areas with large slopes - more than 0.020 (only in mountainous areas)
- Motorways: 8-width of one lane in meters, 2-number of lanes, C-surface material (C-cement concrete,
- A-asphalt concrete); embankment (4-height of embankment in meters)
- Improved highways: 8-width of the covered part;
- 10 is the width of the entire road from ditch to ditch in meters,
- A-coating material (A-asphalt concrete, C-cement concrete,
- Br-paving stones, Kl-clinker), excavations (5-excavation depth per meter)
- Highway: 5-width of the covered part) 8-width of the entire road from ditch to ditch in meters; B-coating material (B-cobblestone, G-gravel, K - chipped stone, Shl-slag, U-crushed stone); casing.
- 1) Light roadside structures (pavilions, sheds);
- 2) congresses; 3) road sections with a small turning radius (less than 25m)
- Improved dirt roads (8-way width in meters) and hard-to-travel road sections
- Roads under construction: 1) motorways; 2) improved highways; 3) highway, 4) improved dirt roads.
- 1) bridges over minor obstacles
- 2) sections of roads with large slopes (8% or more),
- 3) road numbers
- Dirt roads and hard-to-travel sections of roads
- Field and forest roads
- Caravan routes and pack trails
- Hiking trails and footbridges
- winter roads
- Paved roads
- Fashinny sections of roads, gati and rowing
- Stone, brick walls and metal fences along the roads.
- Trays for lowering the forest
- Sections of trails on artificial cornices-ovrings (in the numerator - the smallest width, in the denominator - the length of the cornice in meters)
- The boundary of the change of pavement material on highways.
- Kilometer signs, signatures of the number of kilometers
- Overpasses over
- railway:
- K-stone (material
- buildings), in the numerator - the length and width of the roadway in meters, in the denominator - load capacity in tons
- Overpasses over
- highway
- (ex. - passage under
- overpass: 5-height, 9-width of passage in meters)
- Moving on the same level
- Tunnels (in the numerator
- -height and width,
- in the denominator
- - length in meters)
- aqueducts
- Double deck bridges:
- highway under the railroad;
- 2) highway over the railway.
- State (1-kopets;
- 2-border mark)
- Polar possessions of Russia
- Territories, regions and autonomous regions that are not part of the territory, administrative units of the 1st order in a foreign territory
- Autonomous regions that are part of the territory, national districts
- State reserves
- Industrial, agricultural and socio-cultural facilities
- Factory and factory pipes
- Oil and gas rigs
- 1) TV-
- towers
- (508- height
- towers in meters);
- 2) radio masts, television
- nye and radio relay masts
- (5O-mast height in meters
- Light towers
- Tower-type capital structures
- Transformer booths
- Waste heaps»
- dumps (25 and 15-
- height in meters):
- 1) Expressive
- at the scale of the map;
- 2).Sleds not expressed in scale.
- wind turbines
- water mills
- and sawmills
- Kilns
- lime, charcoal
- Plants, factories and
- mills with pipes
- Plants, factories and
- mills without pipes
- mining sites
- fossil open
- way
- Expressed in map scale.
- Sledges not expressed in scale
- Mines and adits
- current
- Mines and adits
- inactive
- open salt
- development
- Peat mining
- power plants
- Expressed in map scale.
- Sledges not expressed in scale
- Oil and gas wells without rigs
- Fuel depots and gas tanks
- Petrol stations and gas stations
- Radio stations and television centers
- Windmills
- 1) Airfields and
- hydroaerodromes;
- 2) Landing pads
- Telegraph, radiotelegraph offices and branches of telephone exchanges
- Weather stations
- Monuments, monuments, mass graves; tours and stone pillars over 1 m high
- Foresters' houses
- Churches
- chapels
- Mosques
- Buddhist monasteries, temples and pagodas
- Mazars, suburgans, obo
- Cemeteries
- Cemeteries with trees
- Expressed in map scale.
- 2) Not expressed
- at map scale.
- Animal burial grounds
- Livestock pens
- Apiaries (shown only on a map of scale 1: 25,000)
- Communication lines (telephone, telegraph, radio broadcasts)
- Power lines on wooden poles
- Power lines on metal or reinforced concrete poles (25-pole height in meters)
- Ground oil pipelines and pumping stations
- Underground oil pipelines
- Gas pipelines and compressor stations
- Ancient historical walls (5-wall height in meters)
- Stone, brick walls and metal fences
- Main point position outside large-scale conventional signs
- Points of the state geodetic network (91.6-height of the base of the point above sea level)
- 1) The same on buildings (they are not shown on a map of scale 1: 100,000). 2) The same in churches.
- Survey network points fixed on the ground by centers
- The same on mounds (2 is the height of the mound in meters)
- Astronomical points
- Leveling marks and benchmarks (ground)
- Contours
- Signatures of horizontal lines in meters and direction indicators
- stingrays (bergstrokes)
- Dry riverbeds
- 1) Marks of command heights.
- 2) Elevation marks
- Landmark elevations
- Ravines and gullies: 1) more than 1 mm wide on the map scale; 2) 1 mm wide or less (in the numerator - the width between the edges, in the denominator - the depth in meters)
- 1) Cliffs (21-height in meters); 2) fortified ledges of fields on terraced slopes
- Mounds: 1) expressed on the scale of the map (5 - height in meters); 2) not expressed in map scale
- Pits: 1) expressed on the scale of the map (5-depth in meters); 2) not expressed in map scale
- Rocks - remnants (10-height in meters)
- Dikes (steep-walled ridges of hard rock)
- Volcanic craters not expressed on the map scale
- Mud volcano craters
- Separately lying stones (3-height in meters)
- Clusters of stones
- sinkholes
- Entrances to caves and grottoes
- lava flows
- Sod ledges (edges) that are not expressed by horizontal lines
- Landslides
- Sandy and earthy
- talus
- rocky and
- crushed stone scree
- Naledi
- Ice cliffs (barriers) and fossil ice (7 - height
- break in meters)
- Image of some relief elements on maps
- a) Firn fields (eternal snow), b) Glaciers, c) Glacial
- cracks, d) moraines,
- e) Stone rivers. e) Stony
- placers. g) Rocks and rocky
- cliffs, h) Steep slopes
- length on a scale
- cards less than 1 cm. i) Cool
- slopes of
- map scale over 1 cm. j)
- Firn fields borders
- 1. Selective attitude to the content of the map: read not everything in a row, but selectively, fixing attention on those areas and elements of the content of the map that are relevant to solving the problem.
- 2. Cumulative reading of conventional signs: the conventional signs of the objects under study should not be considered in isolation, but in mutual connection with the image of the relief and other elements of the terrain, thereby determining the joint influence of all these objects on the performance of the task in relation to which the terrain is being studied.
- 3. Memorization of what has been read: reading a map must be accompanied by comprehension of what has been read and memorization of the image of the terrain considered on it, especially those objects that are the subject of study and identification in kind when performing a combat mission.
- Study the lesson material according to the abstract.
- In the course of independent work, use the recommended
- to the lesson of literature:
- - textbook "Military topography". Military edition 1972 chapter 12,
- pp. 60-63, chapter 13, pp. 63--89.
- - textbook "Military topography for cadets
- divisions." Military publishing house, 1973, edited by A.F. Lachin,
- B.E. Byzov, I.M. Prishchepa. Page 7-33, 37-65.
- - textbook "Fundamentals of military service". "Phoenix 2001", under
- edited by V.A. Vasiliev. Page 262-266.
- - "Officer card". Military Publishing, 1985, edited by Pombrick
- I.D., Shevchenko N.A. Page 150-173.
- - IOS - information and educational site of SSTU
- named after Yu.A. Gagarin
Conventional signs of topographic maps
SYMBOLSTOPOGRAPHIC MAPS
7.1 The concept of a conventional sign and its purpose
7.1 THE CONCEPT OF THE CONDITIONALSIGN AND ITS PURPOSE
Cartographic symbols are
graphic constructions (notations)
certain size, shape and color, with
which are used to show on maps
various geographical objects and objects
terrain (settlements, rivers, lakes,
relief, vegetation, iron and horse-drawn
roads, etc.). All terrain features
depicted on the plans in orthogonal
projections (top view) in the form of lines, points or
contours Concerning lines and points that correspond
the actual position of objects on
terrain, build conventional signs, and inside the contours
give filling (explanatory) symbols,
generally in shape and appearance
resembling the object depicted. For example, in
scale 1:10 000 the forest is represented by circles
with a diameter of 1.1 mm, young shoots - circles
smaller diameter, 0.6 mm, rare forest -
circle with undercut. This approach to
image of related objects
uniform conventional signs contributes
their best memory. Symbols are designed in such a way that
they could be easily built and drawn by hand
or with drawing tools.
Most of the symbols are
a combination of dots, lines, strokes and simple
geometric shapes. Symbols developed
also taking into account the optimal proportions of its
designs, the possibility of their reproduction in
printing without losing quality To improve the readability of the map and to distinguish
displayed terrain objects, for conditional
signs introduced the following colors: blue - with
hydrography image, brown - relief,
black - settlements, road network, etc.
7.2 Types of symbols
Great variety of objectsterrain according to shape, square led
to the need for classification
conventional signs Large-scale (areal) symbols.
Scale symbols are applied
when the dimensions of the terrain objects
expressed at the scale of the map. objects,
projected onto the map in the form of a limited
the contour of the area and filled inside
conventional signs or signatures are called
areal or contour. Inside the square
conventional signs are placed evenly in
arbitrary or strictly defined
arrangement. Conventional signs that fill the entire
area, do not indicate any location
the objects themselves within the contour, nor their
quantity or size Sometimes instead of filling symbols
background color is applied. For instance,
the area occupied by the forest is painted in
green color. Sometimes filling is used
area with a dashed symbol on
background coloration. For example, area
occupied by fruit and citrus
gardens, painted over in green and
fill in with dashed symbols in
the form of circles located
vertical and horizontal rows Often on the original map instead
filling symbol inside the contour
provide an explanatory note. For example,
on a scale plan of 1:5,000, the outline of the garden is not
filled with hatching or gray fill
colors as it is done on the scale map
1:10 000, and signed - "garden" Linear symbols.
Linear symbols include conventional
signs having a linear extent - roads,
borders, hedges, etc. On the map of their projection
look like lines. Linear symbols
preserve on the scale of the map the extent of one or
another object, and the width of the object can
exaggerate. The symbol is under construction
relative to the axis of a linear object On plans of scale 1:2,000, 1:5,000, etc. roads
are expressed on the scale of the map not only in length,
but also in width. On both sides of the freeway line
dotted green line (or two
parallel lines) a ditch is shown. V
rupture of the road is given its characteristics,
denoting: 8 - bandwidth in meters; 2-
number of lanes; 24.5 - the width of the road from the ditch
to the ditch, in meters; C - coating material Off-scale symbols.
This type includes conventional signs of individual
objects of the area, the area of which is not
expressed at the scale of the map. Their projection on
map is a point. About this point
one or another off-scale sign is being built. To such
objects of the area can be attributed points
state geodetic network, separately
standing trees, road signs, windmills, etc. The symbol is centered on a point in different ways, in
depending on its shape and pattern: if conditional
the sign looks like a geometric figure, then
actual situation on the ground
object corresponds to its geometric center
(a); if there is a straight line in the figure of the symbol
corner, then the vertex of the corner is taken as the center of the sign or
the base of the sole of the sign (b); if the symbol is represented by a figure with
wide base, then such a sign
centered on a point by the middle of the base (c);
if the symbol is
a combination of several figures, then such a sign
centered on a point by the center of the bottom shape
(G) Off-scale conventional signs orient
relative to the northern and southern borders of the map, or
the middle meridian, and not relative to the contour,
in which it is placed (d). Kilometer poles
oriented relative to the road, i.e. are put
perpendicular to its line (e) Explanatory symbols and signatures,
digital characteristics.
A special group includes explanatory
signatures and digital data that are given on
card additional quality or
quantitative characteristic. They are like
usually used in conjunction with
scale, linear and off-scale
conventional signs To explanatory symbols
include, for example, signs indicating
the predominant type of forest or
shrub. Here is a quantitative
characteristic denoting the average
height of trees or shrubs, average
the thickness of the trees, as well as the density of the forest. On the
swamps is signed by their average depth Often an explanatory label on the map
given in abbreviated form. She usually
located to the right of the symbol or
in a free place where she's good
visible. The signature is placed on such
distance from the symbol, so as not to
doubts arose as to which conditional
it belongs to the sign. explanatory
signature, as well as numerical characteristics,
located parallel to the north and south
map frame The exception is the signatures of buildings on
topographic plans at a scale of 1:2,000 and larger. They
are placed inside the contour of buildings, in the middle,
parallel to the long side of the building. The same applies to
signatures of area symbols, for example, "garden"
7.3 Symbol tables
7.3 CONDITIONAL TABLESSIGNS
Drawing, color and size of symbols for
topographic maps and plans set
in special tables of conventional signs.
Tables of conventional signs published in
Russia, are mandatory for all
departments and institutions surveying or
drawing up a topographic map (plan)
on one scale or another Symbols of all scales are
standard and usually agreed
among themselves in form (drawing) and color. V
only changes with scale.
symbol size. Such consistency
facilitates card sharing
different scales. For each or several
scales are published tables of conventional signs For example, conventional signs in the tables "Conventional
signs for a topographic scale map
1:10,000", published in 1977, grouped by
sections according to the main objects
terrain: geodetic points; inhabited
points and individual buildings; industrial,
agricultural and socio-cultural
objects; railways and structures attached to them;
hydrography; relief; vegetation; soils and
microforms of the earth's surface; borders and
fences In addition to conventional signs, the tables contain
samples of fonts for inscriptions, scales of foundations,
framing and framing.
Such a grouping of conventional signs into sections
makes them easier to use. In addition to the conditional
signs in the tables give examples of their combinations, and in
at the end of the book are explanations of the conditional
signs giving instructions on
drawing one or another conventional sign (its
orientation, drawing sequence,
centering rules, etc.) Most convention tables consist of
three graphs. The first column contains the ordinal
the number of the symbol, in the second - the name
conventional sign and in the third - its image.
Near the image of the conventional sign, its
dimensions. Sometimes in the column "image" there are two
sign under the headings "a" and "b". At the symbol
under the heading "a" are the dimensions, and the symbol
under the heading "b" there are no sizes. It means that
the first character is used when the dimensions
object are not expressed to scale, the second - when
its area is shown on the scale of the map The symbol should be drawn by
color as it is given in the conditional tables
signs. The exception is the elements
hydrography. In the tables they are given in blue or
blue color. When drawing
filming original line drawing
blue is replaced with green. Also
most applies to hydrographic inscriptions and
symbol of swamps Sometimes the column "image is divided into two
columns. The first column shows
image of the symbol as it is
is performed on the shooting original, and in
the second is as shown on the colorful
impression, i.e. on the published map. tracing
conventional signs on the shooting original in
scale 1:10 000, their image follows
take from the first column - "on the set
original" Quite often after the name
symbol in square bracket
there is a figure, it refers to
explanations at the end of the tables.
Here are examples of using
tables Example 1. It is necessary to draw on the shooting
original topographic map symbol
"capital structures of tower type". This
the sign is in the tables "Conventional signs for
topographic map at a scale of 1:10,000" on
page 5 tab. 3, no. 16a. It can be seen from the table that
symbol is drawn in black,
its total height is 3.0 mm, and the diameter of the filled
mug is 1.2 mm. In addition, to the right of
conventional sign is given the signature "waters", height
2.1 (or 1.8) in lowercase (see
tables symbol No. 527, p. 66) Example 2. It is necessary to find in the tables and draw on
shooting original, the conventional sign "continuous thickets
shrubs." This symbol is on page 47 No.
361. In the column "image" two images are given
this symbol. In the first case, the symbol
shrub is shown in red on a white background, and in
the second - in black on a green background. Image
the symbol is taken from the column "on the shooting
original" In the middle of the contour, a characteristic is given
bushes: a symbol is drawn
wood in black and put a number,
denoting the average height of shrubs in
meters. The size of the symbol of the tree can be
find in the tables (symbol No. 363). In the end
the name of this symbol is a number
203. In "Explanations to Conventional Signs" on p.
109 in § 203 we find: “Solid thickets
shrubs in the presence of additional
requirements (when surveying for land reclamation
lands, etc.) are characterized on the map
an inscription indicating the predominant
breed - "willow", "juniper", etc. "
7.4 Methodology for constructing and drawing conventional signs
7.4 CONSTRUCTION TECHNIQUE ANDDRAWING CONDITIONAL
SIGNS
This paragraph deals with
construction and drawing technique
the most commonly used conditionals
signs on the example of a scale of 1:10,000 and
some signs of scales 1:50 000 and
1:2 000Conventional signs, as a rule, are built first in
pencil, and then drawn in various
ink color. When constructing a conditional sign
use a sine device, thickness scale
lines, as well as plastic palettes and
stencils. Ink drawing conventional signs
draw with a drawing pen
(according to the ruler), single crank or
double, caliper Geodetic points.
Geodetic points are plotted on the map by
coordinates, so they must be
drawn with great care. Consider
order of construction and drawing of some
geodetic points and symbols Example 1. Conventional sign of the state
geodetic network (triangulation point). Table
on the left side of the sign, the size is 2.0 mm. This
means that you must first build
in a pencil, a square with sides of 2.0 mm.
The construction of a square begins with holding in
pencil horizontal and vertical lines
through a point plotted by coordinates and
corresponding to the actual situation
triangulation point on the ground. shifting
sinus ruler from the horizontal line by 1/3
down and 2/3 up from the specified nominal size
sign (approximately this will correspond to
values of 0.7 mm and 1.3 mm), carry out
auxiliary lines The same lines are built at a distance of 1.0 mm to the left and
to the right of the dot. The resulting triangle vertices
connect. When drawing a symbol
ink can be used with a drawing pen, but
draw the sides of the triangle
ruler. So that the ink from the drawing pen does not
leaked under the ruler, it is best to use
wooden ruler with plastic insert
in the middle of the ruler or a small plastic
triangle on small legs-stands, i.e.
the edge of the ruler or triangle should be slightly
raised. For ease of use, the ruler and
the triangle should be small
size Settlements and individual buildings.
The drawing of the settlement begins with
objects that have the value of landmarks
(industrial enterprises, facilities
towers, churches, etc.) Symbol of a capital structure
tower type begin with building it
lower part, i.e. from the circle. By placing the needle
caliper to a point that corresponds
the actual position of this building
on the ground, draw a circle
with a diameter of 0.6 mm, then a
vertical pencil line and
lay on it up from the bottom
circumference equal to the total height
conventional sign, i.e. 3 mm. Fill circle
performed in black ink using a drawing
pen After objects that have the value of landmarks,
draw the main streets and driveways, as well as
prominent buildings and buildings, separately
located outside the quarters, other passages and
buildings within neighborhoods. Straight sections
streets and driveways are drawn by a drawer according to
ruler or double drawing pen, and
curved - according to patterns or drawings
pen by hand. If the symbol of any
landmark breaks the line of the street, then the line
streets are not brought to the symbol by 0.2 mm All are drawn along the ruler with a drawing pen
large buildings, and on the plans 1:5,000, 1:2,000,
1:1 000 and 1:500 - almost all buildings.
Large buildings on a scale of 1:10,000,
1:25,000, 1:50,000 and the built-up part of blocks
easier to draw with a drawing pen,
using the small triangle
legs-stands or a short ruler with
insert. Small buildings are drawn
drawing pen by hand, while you need
ensure that building corners are clear
marked When drawing a settlement of a rural
type on a scale of 1:25,000 and 1:50,000 after
drawing the main streets and driveways
allocate the built-up part of the settlement
drawing lines parallel to the lines of the streets,
at a distance of 1.4–1.5 mm (1:25,000) or 1.1–
1.2 mm (1:50,000) from them. Built-up part in
scale 1:25 000 is isolated on the shooting
original painted yellow or orange
colors depending on the predominance in the quarter
non-fire-resistant or fire-resistant buildings On topographic plans at a scale of 1:5,000
non-fireproof residential buildings are shown
single hatching, and the buildings are fire-resistant
non-residential - cross hatching. For
hatching use sinus
rulers and drawer. Hatching in progress
at an angle of 45° to the card frame line. Depending on the orientation of the buildings, the angle
hatching may vary slightly, it is important
so that the hatch lines are not parallel
building lines (Figure 7.5a). On the plans
scales 1:2000, 1:1000 and 1:500 are given
characteristics of each building. Inside
building outlines are lettered material
walls (only for fire-resistant), purpose
buildings (residential, non-residential, etc.) and numbers -
number of storeys On a scale of 1:10,000 hatched in the form
alternating dotted and solid lines
allocate vegetable gardens. Depending on the
dimensions of the area of the distance between the lines
hatching can be changed: give more
sparse over large areas and less
sparse - on small ones. On large areas
hatching is performed in different directions, but
it should not be parallel to the contour lines
vegetable garden. Pre-garden area
break with pencil lines
into several areas. First
dotted line is given
then solid Industrial, agricultural and socio-cultural facilities.
The figure shows the construction of industrial and
agricultural objects depicted
off-scale conventions. Building all these
conventional signs start from the point that corresponds to
the actual position of the object on the ground.
The dotted line shows the auxiliary pencil
constructions that are performed using sinus
rulers and stencils. Conventional sign of the mouths of mine shafts
in the figure, you can start with ink drawing
circles and then do
auxiliary
pencil constructions
to complete
constructing a symbol Pipelines, power lines, etc. draw
drawer on a ruler, pattern or with the help of a crooked leg.
The details of these symbols (arrows, dots, transverse
strokes, etc.) are marked with a pencil using
special stencils or stencils made on
edge of thick paper. For example, when executing the conditional
sign of ground and aboveground pipelines on supports (c)
first of all, transverse strokes are marked in a pencil, and
circles. Then draw with ink 0.1 mm thick
pipeline line. Draw with a drawing pen
transverse strokes, and with the help of calipers - circles
diameter 0.8 mm Road network and road structures.
Railways and highways are
linear conventional signs and are drawn on
topographic maps single, double or
triple line. Straight road sections
draw with a drawing pen on a ruler, and
curvilinear - according to patterns, single or
double cranked. When drawing
road network, it is necessary to ensure that
the drawing of the symbol was located
symmetrical about the axial pencil
lines Railways on topographic maps
shown as a single black line. V
line thickness depending on the scale
is changing. Cross strokes through
a certain interval is denoted by a number
paths on hauls Highways and dirt roads according to their degree
technical condition are divided into motorways,
improved highways, highways, improved
dirt and dirt country roads,
hiking trails, etc. On highways of high
class is given a characteristic that denotes
the width of the road and the material of its covering. Before
to draw a road, it is necessary to outline the places where
this characteristic will be given (after about 8–10
cm). On page 66 Symbols of scale 1:10 000
under No. 534 examples of numerical characteristics are given,
their size and font. Instead of topographic 2nd
fonts on the shooting original are used
font When drawing a conditional sign of a freeway
first draw its axial line with a thickness
0.1mm, and then two side thickened.
Drawing begins with curvilinear
sections of the road. According to the line thickness scale
install drawer pendulums on
thickness of 0.3 mm and the corresponding distance
between the referees. Then draw
straight sections of roads with a drawer with
using a sinus instrument When moving the sinus ruler from the axial
lines must be taken into account not only
a given gap of 0.75 mm, but also the thickness
lines 0.3 mm. Therefore, the sine line
move by 1.0–1.1 mm
(0.75 + 0.3). Then the preset will be saved.
spacing of 0.75 mm and the total width of the road
will be 2.2 mm When drawing field roads, caravan routes
and hiking trails are marked with a pencil
using a plastic stencil, the length of the strokes
and gaps. The stencil can be done on the edge
small thick paper
sinus instrument or thickness scale. On the edge
paper outline 5-6 strokes and gaps between
them. Moving the stencil along the axial
pencil line of the road, mark with a pencil
length of strokes and gaps. On sharp turns
roads, a whole link is necessarily drawn. If
necessary,
link lengthen Conventional sign of mast semaphores and
traffic lights is drawn so that it
longitudinal axis was perpendicular to the north and
southern frame. Building and drawing
symbol of semaphores and traffic lights shown
on the image.
When drawing the conventional signs of the embankment and
recesses first draw lines with a pencil,
limiting the length of strokes. strokes
are drawn at a distance of 1 mm from each other, they are not
lead to the railroad line
0.2 mm. To the edges of the symbol length
strokes is reduced to 0.3–0.4 mm Borders and fences.
Building and drawing borders and fences
has a lot to do with building and drawing
field roads and trails. The figure shows
construction and drawing sequence
conditional sign of the state border. middle
symbol strokes borders and centers
circles between them
lie on the center line that corresponds to her
actual position on the ground With a sinus instrument from the center line
draw two pencils in both directions
parallel lines that limit
length of transverse thin strokes. Then with
using a stencil, mark the length of the links and
spaces between them. cross strokes
can be drawn with a drawing pen or drawing
pen along a ruler or triangle (on legs) The links are drawn with a drawing pen or
cranked peduncle with the thickness indicated in the tables
conventional signs (in our example - 0.6 mm).
The circles between the links have a diameter equal to
link thickness. They are drawn with calipers,
and then filled with ink using a drawing
pen. If the diameter of the circles is about 0.4 mm
(conventional sign for the boundaries of districts), then they can be
draw with a drawing pen. But it is necessary
so that they are round. Link edges
should be even Relief.
The relief on topographic maps is depicted
horizontal lines and symbols of those forms
relief, which are not expressed by contour lines:
ravines, cliffs, landslides, sod ledges,
talus, rocks, etc. Horizontals - lines of equals
heights. For the convenience of determining the height of the relief
on the map every fifth or tenth horizontal in
dependencies on the section of the relief are drawn
thickened line. If the main horizontal
is drawn with a thickness of 0.1 mm, then thickened -
0.2–0.25 mm To highlight the characteristic landforms, not
expressed by major horizontals, or
to convey changes in slope steepness
draw additional horizontal lines, and for
surface microrelief transfer (depressions,
bumps, saucers, etc.) - auxiliary Additional and auxiliary horizontals
depicted by a dotted line, on sharp bends
horizontal lines it is necessary to draw a link,
what is achieved by increasing or decreasing
link or gap length. All links
additional and auxiliary
horizontal lines must be coordinated according to
direction, i.e. continue each other To make it easier to read the map on contour lines
inscriptions and bergstrokes are given - strokes,
showing the directions of slopes, contour lines.
Labels are placed at breaks in contour lines.
so that they are located in the middle of the gap and
with their base turned to the side
relief depression. Labels must be placed
so that they can be easily read.
Bergstrokes are drawn strictly perpendicular to
horizontal and arrange them along the catchment lines
and watershed The relief image is supplemented with numerical
marks of characteristic points of the terrain, ravines,
cliffs, gullies, mounds, pits and other
positive and negative landforms.
On topographic maps and plans, most
relief elements and their numerical characteristics
are given in brown, and the marks of characteristic
dots are black. Rocks, ridges of stones, fortified ledges, etc. are given in black. Ravines and gullies less than 3 m wide in
scale 1:10 000 draw single
line with gradual thickening (c) Ravines and gullies from 3 to 10 m wide
are drawn in two lines, and numerically
the characteristic is indicated in the numerator - the width
on top, in the denominator - the depth (in meters).
If a ravine with a steep slope has a width
more than 10 m, then it
draw with
preservation
actual width
map scale (g) (e) shows the sequence
drawing this conventional sign (given
characteristic of only the depth of the ravine). Before
just draw the edge of the ravine with a thickness
0.1 mm, mark the height line with a pencil
teeth parallel to the crest of the ravine and only
after that, the cloves themselves are drawn. teeth
ravines are in the form of elongated triangles with
base 0.3–0.4 mm and
draw them strictly
perpendicular
to the edge of the ravine The maximum height of the teeth at the widest
and the deep part of the ravine is 1.5 mm, in the narrowed
part of the height of the teeth is reduced
up to 0.3–0.4 mm. Distance between teeth
approximately equal to their height. In narrowed
parts of the ravine after the smallest in height
the crest of the ravine is drawn
thickened line (the sign of the ravine). Conditional
the break sign is drawn in the same way
conventional sign of the ravine Image of sod ledges, in
basically, it resembles a conventional sign of a cliff,
only cloves are given in the form of "cilia", i.e.
teeth have a slightly smaller base and
more closely spaced to each other. Besides
moreover, the edge of the turfed ledge with ink is not
drawn Construction of a conventional sign of turf
the ledge begins with drawing in a pencil
brows (in the figure - a dotted line) and lines,
marking the height of the teeth (e). Then ink
draw teeth, which, with their base
turned to the elevation of relief. After
drawing teeth pencil line
gently erased with a soft rubber band Screes are divided into screes of loose rocks
(sandy, clayey) and talus of hard rocks
(stony-gravel and pebble).
Sequence and techniques for drawing talus
(g) the following: draw with brown ink
edge of the scree, and in those places where the slope is steep,
- cliff teeth; draw a line in pencil
talus; draw in brown ink drawing
pen symbol of sand (if it is a scree of loose
breeds), and at the edge and in the middle part of the tongues
scree points are given larger, and towards the edges -
small If these are talus of hard rocks, then draw
conventional sign of pebbles or rocky
surface, and between these signs
draw a conventional sign of sand. Main
horizontal lines through the drawn signs are not
carry out Vegetation cover and soils.
Elements of vegetation cover and soils
relate mainly to contour conditional
signs, as they occupy a certain area on
map. The contour of vegetation or soil can
transmitted as a closed line or point
dotted line. When depicting contours,
all their angles, turns and sharp
curves Dotted line drawn with a drawing pen
black ink with round dots with a diameter of 0.3 or
0.2 mm and at a distance of 1.0 or 0.8 mm depending on
from scale. To get round dots do
circular movements with the pen, without tearing off both flaps
from paper. Most of the woody vegetation
shown as circles of different diameters, colors
and drawing Symbol of the forest (a) for the transfer of solid
stands are circles with a diameter
1.1 mm, placed over the entire area without
drawings. First, inside the contour of the forest is placed
tree characterization. It shows
the predominant tree species signed and
tree pattern (deciduous or coniferous). If the forest
mixed, two signatures and two drawings are given
tree Figure b shows the construction and drawing
characteristics of the mixed forest stand. On right
from the drawing of trees is placed numerical
characteristic of the forest stand in meters: in the numerator -
the average height of the trees, in the denominator - the average
stem thickness. Tree drawing and caption
the dominant species of the forest is placed
symmetrical about the line of the fraction. Between
fraction bar and numbers (upper and lower)
leave a gap of about 0.5 mm Then circles are drawn with calipers. And according to
at the edge of the forest, the mugs are denser, for
large areas of forest - at a distance of 6-8 mm
from each other and closer to the dotted contour of the forest.
More than
dispersed (at a distance of about 1 cm and
more). The growth of the forest is drawn in circles
diameter 0.6 mm - smaller than an adult forest To fulfill the conventional signs of the young
forest plantations and nurseries are first built
pencil line through 2 mm (c).
Intersecting hatch lines gives centers
circles. Drawing them with calipers is better
do line by line, through one intersection of lines
(in checkerboard pattern)
given in random order. Before
in total, throughout the area, places are marked where they will be
ruler or freehand Conventional signs of a rare forest, windbreaks,
cut, burned and dry forests
given in random order. Primarily
throughout the square, places are marked where they will be
draw these signs, and make
auxiliary constructions in pencil for
each symbol. Ink drawing
perform with a caliper, a drawing pen according to
ruler or freehand Figure (d) shows the construction of conditional
signs of windbreaks, burnt and dry
forests Solid thickets of shrubs and saxaul
drawn in red ink. Sign
shrub consists of circles of two sizes.
The central circle of shrubs is drawn
calipers, and three filled circles can be
draw with a drawing pen. Symbol
saxaul has a more complex pattern, on (e)
its construction is shown Filling conventional signs of grassy
vegetation, reed and reed
thickets, moss vegetation and a number of other
inside the contour are placed in a checkerboard pattern
okay. Therefore, they require
preliminary pencil drawing
sinus instrument or stencil The symbol of meadow vegetation has
height 0.8 mm and width 0.6 mm. Distances
between characters are 4.0 mm vertically and
4.0 mm horizontal. Specified dimensions
include the height and width of the character. So
vertical slicing is done through 0.6 mm and
3.4 mm, and horizontal - through 0.8 mm and 3.2 mm
(e) Drawing with a drawing pen conditional
meadow signs are performed line by line, through one
cage, such an order will not allow you to stray from
accepted chess arrangement On (g) the construction of a conventional sign is shown
reed and reed vegetation. Medium
part of the symbol is made in the form
exclamation point, and two side parts -
slightly curved lines with slight thickening
at the top. At the bottom, all three parts
drawings should be on the same line, at a distance
0.3mm apart The conventional sign of a bumpy surface has
view of three points located at the vertices
conditional equilateral triangle.
Horizontal line in pencil
performed through 3.0 mm and 1.0 mm, and
vertical - through 4.0 mm The top point is drawn on
vertical pencil drawing, and two
others - on the lower horizontal line on
1.5 mm apart. This
distance between points can be maintained
approximately. The symbol is being drawn
brown ink drawing pen Sands are also drawn with brown ink.
The symbol has the form of small dots with a diameter
0.1 mm, located close to each other and
evenly over the entire area. So that when
drawing a symbol of the sands did not work
any pattern in the form of concentric
circles or straight lines, first apply
points along a broken horizontal line (b), and then
fill empty spaces evenly On (c) shows the sequence of drawing
symbol of ridge sands on a scale
1:50 000. First over the entire area in pencil
a drawing of the ridges is planned, (the ridge must be strictly
parallel to the northern or southern frames).
The drawing of each ridge begins with the most
major central point So that the ridge is perceived as one conditional
sign, the rest of the points, gradually decreasing to
edge of the ridge, placed close to each other. Their
the size must be larger than the size of the dots of even
sands that fill the rest
space. The same sequence
observed when drawing hilly sands,
dune, hole and cellular On topographic maps, swamps are subdivided
permeability and nature of vegetation.
The drawing of a symbol of swamps begins with
drawing signs of vegetation, which
are placed without markings, evenly throughout
area. If the swamp is impassable or
impassable, then with the help of a drawer on
sinus rulers are hatched in green
ink (instead of the blue given in the Symbols)
after 1.0 mm, interrupting it at signs of vegetation When performing a conditional sign passable
swamps (g) after drawing signs
vegetation outline the contours of hatching in
pencil. Hatching is drawn within
pencil outline. Areas free and
occupied by hatching should be
approximately the same
7.5 Ways to perform conventional signs
7.5 METHODSCONDITIONAL
SIGNS
When building symbols, a lot of time
take preliminary pencil
construction. Significantly speeds up this process
the use of various palettes and stencils,
made on a transparent basis, which
allow for uniform dimensions
conventional sign throughout the area The figure shows a plastic stencil for
marking the position of the circles of the symbol
fruit and citrus orchards. turned on
The 45° stencil can also be used for
building a sign of young forest plantings
REFERENCES
Egorova T.M. Land management drawing: textbook. allowancefor universities / T.M. Egorova.– M.: Nedra, 1982.– 150 p.
Engineering graphics / V.P. Raklov and others - M .: Kolos, 2004. -
304 p.
Kremneva, A.M. Cartographic drawing and
engraving on plastics / A.M. Kremneva, T.A. Fokina.–
Moscow: Nedra, 1971.
Lebedev, K.M. Topographic drawing. - M .: Nedra,
1981.
Rules for drawing conventional signs on topographic
plans of underground utilities of scale 1:5 000,
1:2000, 1:1000, 1:500 / GUGK.– M.: Nedra, 1981.– 44 p.
Topographic drawing: textbook. for universities / N.N. Losyakov,
P.A. Skvortsov and others. - M .: Nedra, 1986. - 325 p. Symbols for topographic plans
scales 1:5000, 1:2000, 1:1000, 1:500 / GUGK.– M.:
Nedra, 1989.– 286 p.
Conventional signs for a topographic map
scale 1:10,000 / GUGK.– M.: Nedra, 1977.– 143 p.
for topographic maps at a scale of 1:25,000,
1:50 000, 1:100 000. – M.: VTU GSh, 1983.
Conventions, sample fonts and abbreviations
for topographic maps at a scale of 1:200,000,
1:500 000.– M.: Nedra, 1983. Fedorchenko, M.V. Land surveying drawing:
textbook allowance / M.V. Fedorchenko, V.P. Raklov.–M.:
Nedra, 1991.–336 p.
Khokhanovskaya, V.I. Decryption guide
aerospace images and tables of conditional
signs for the purpose of creating plans and maps /
IN AND. Khokhanovskaya; Krasnoyar. state agrarian un-t.–
Krasnoyarsk, 2009.– 163 p.
Shukova, E.A. Conventional signs on topographic
maps and plans: method. directions to the laboratory. work /
E.A. Shukov; Krasnoyar. state agrarian un-t. – Krasnoyarsk,
2007.– 10 p.
REFERENCES
Instructions for topographic surveying to scale1:5000, 1:2000, 1:1000, 1:500 / GUGK.- M.: Nedra, 1985.152 p.
Kiselev, M.I. Geodesy: Textbook / M.I. Kiselev,
D.Sh. Mikhelev.- M.: Academy, 2004.- 384 p.
Kuroshev, G.D. Geodesy and topography: Textbook. For universities /
G.D. Kuroshev, L.E. Smirnov. – M.: Academy, 2006. – 176 p.
Maslov, A.V. Geodesy. / A.V. Maslov, A.V. Gordeev, Yu.G.
Batrakov. - M .: KolosS, 2006. - 598 p.
Nesterenok, M.S. Geodesy: textbook / M.S. Nesterenok, V.F.
Nesterenok, A.S. Pozniak. - Minsk: University, 2001. -
310 p.
Neumyvakin, Yu.K. Workshop on geodesy: Proc. allowance/
Yu.K. Neumyvakin, A.S. Smirnov.- M.: Kartgeotsentr -
Geodesizdat, 1995. - 315 p. Perfilov, V.F. Geodesy: Proc. for universities /
V.F. Perfilov, R.N. Skogoreva, N.V. Usova.- M.:
Higher school, 2006.- 350 p.
Shumaev, K.N. Geodesy: Ref. allowance / K.N.
Shumaev, A.Ya. Safonov. - Krasnoyarsk. state agrarian un-t.–
Krasnoyarsk, 2006. - 152 p.
Shumaev, K.N. Geodesy. Course of lectures: Proc. allowance /
K.N. Shumaev, A.Ya. Safonov. - Krasnoyarsk: Grotesque,
2004. - 80 p. Shumaev, K.N. Geodesy. Topographic and geodetic
work in land management: Proc. allowance / K.N.
Shumaev, A.Ya. Safonov; Krasnoyar. state agrarian un-t.–
Krasnoyarsk, 2007. - 180 p.
Shumaev, K.N. Topographic and geodetic instruments
outgoing era: Proc. allowance / K.N. Shumaev, A.Ya.
Safonov, F.N. Moiseyonok; Krasnoyar. state agrarian un. – Krasnoyarsk, 2005. – 164 p.
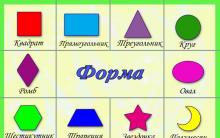
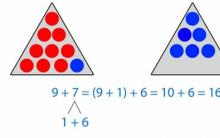

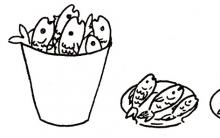


Map second language of geography
Literary games in elementary school Games for children in the library elementary school
Presentation "role-playing games in dow"
The green color on the physical map shows what the colors on the physical map represent
Intellectual game "through the pages of history"